
GitHub Copilot now has a usage metrics dashboard and API for Enterprise customers, giving admins visibility into who’s using Copilot, how often, and what they’re doing with it. The feature is in public preview and disabled by default.
What you actually see#
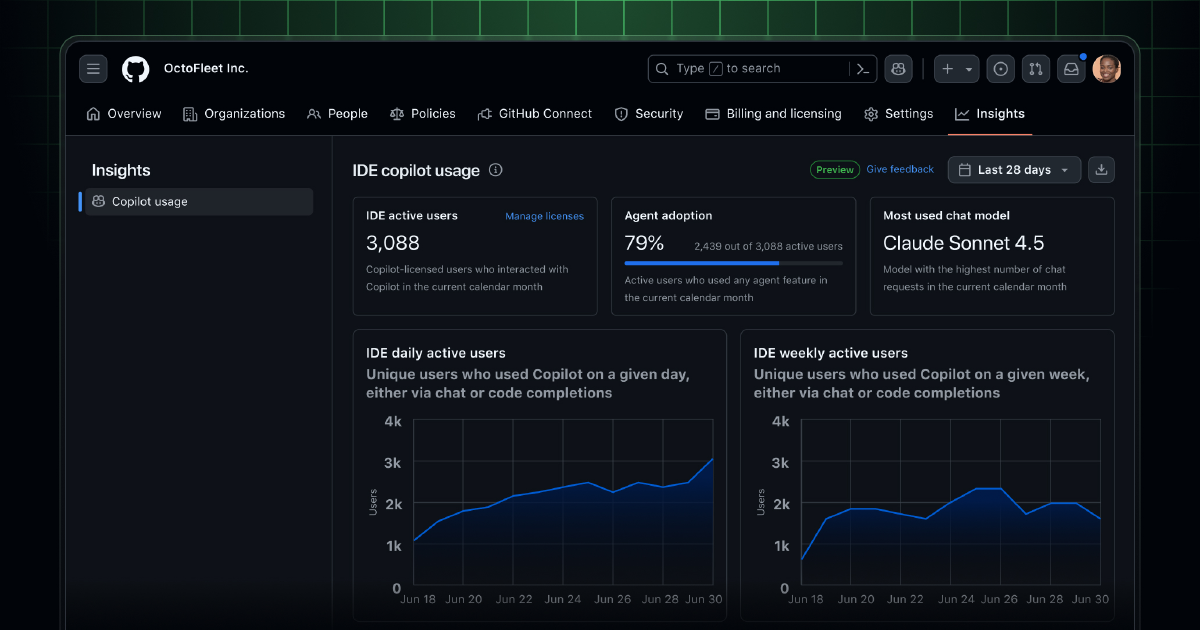
The dashboard shows daily and weekly active users across Copilot’s IDE modes (including agent mode), lines of code added and deleted, language and model usage patterns, and agent adoption rates.
The granularity matters here. You’re not just seeing “500 licenses, 300 active users.” You’re seeing which developers use agent mode for complex refactoring versus basic code completion, which programming languages see the most Copilot activity, and whether adoption is growing or plateauing.
That level of detail turns “we’re spending $500K on Copilot” into “here’s exactly how it’s being used and by whom.”
The ROI question#
Enterprise software procurement always comes down to utilization. You buy 1,000 licenses, and six months later you discover only 400 people actually use the tool regularly.
Copilot has been in that awkward position where companies commit significant budget without clear visibility into adoption. Seat-based pricing means you pay whether developers actively use it or not.
This dashboard changes that. Now you can see which teams are getting value and which teams need training or onboarding support. You can identify power users who might evangelize internally. You can track whether new features like agent mode drive engagement or get ignored.
It’s basic product analytics, but for enterprise tools, basic analytics are often the difference between renewal and cancellation.
The privacy angle#
Usage metrics are disabled by default unless you participated in the private preview. Enterprise admins have to explicitly turn them on.
That’s the right call. Developer productivity tools that track individual usage create pressure and distrust if not handled carefully. Making it opt-in at the enterprise level gives organizations control over whether they want this data.
The trade-off is clear: visibility into usage helps optimize spending and improve adoption, but it also means developers know their AI usage patterns are being tracked.
What GitHub isn’t measuring#
The metrics focus on activity, not impact. You can see how many lines of code Copilot generated, but not whether those lines were good code or throwaway experiments. You can see agent adoption, but not whether developers trust the agent’s output enough to merge it without heavy edits.
That gap is unavoidable. Quality and trust are harder to measure than usage. But it means these metrics answer “are people using Copilot?” without necessarily answering “is Copilot making them more productive?”
How to enable it#
If you’re an Enterprise admin, go to AI Controls → Copilot → Metrics and set Copilot usage metrics to Enabled. Once enabled, enterprise admins and billing managers can access the dashboard from the Insights tab or via API.
Learn more: Check the Copilot usage metrics documentation for setup instructions and API details.